 Daepak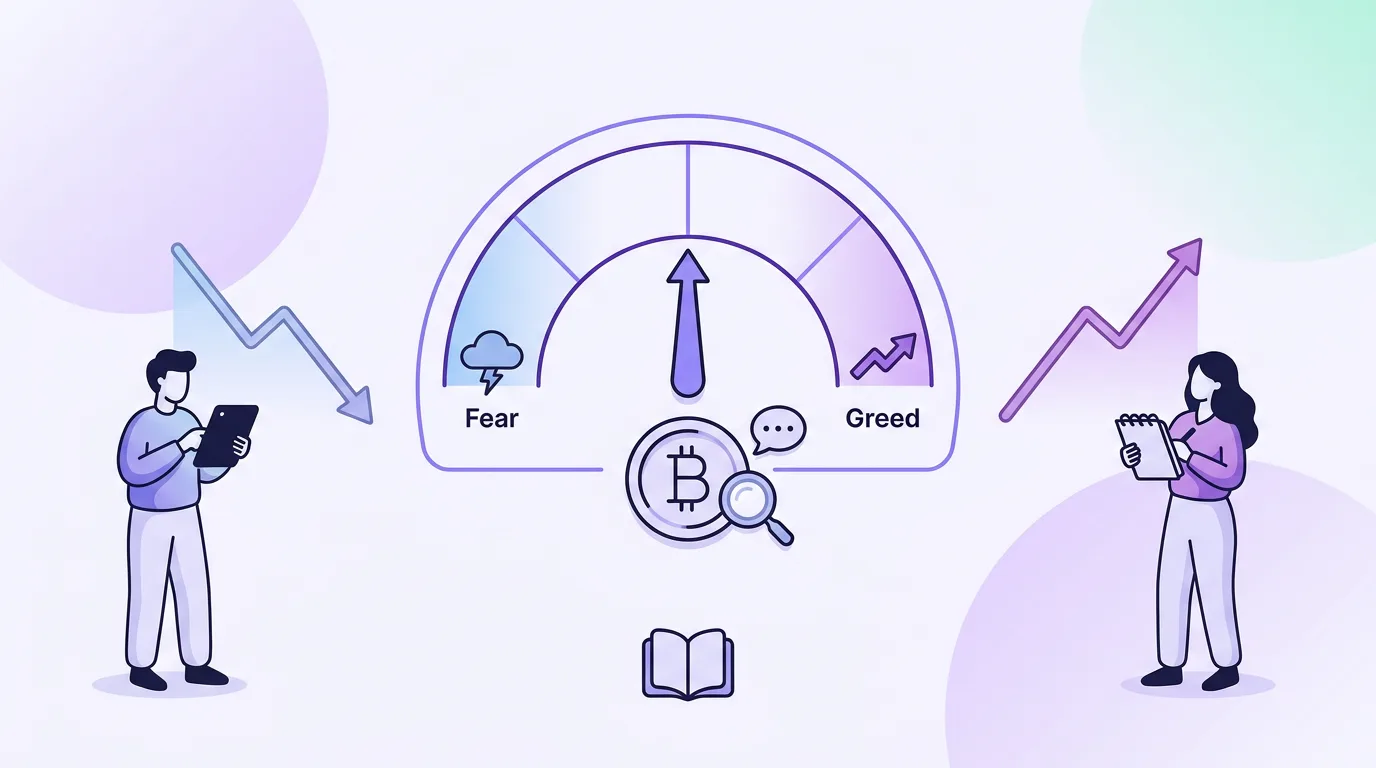
What Is the Fear & Greed Index
The Crypto Fear & Greed Index, operated by Alternative.me, shows the emotional state of the crypto market as a number between 0 and 100. The lower the number, the more fear has gripped the market; the higher, the more greed has peaked. For beginners, this indicator acts as a thermometer for crowd psychology that is hard to see from price alone.
Calculation Principle — Sum of Six Factors
This index is not a simple survey but is calculated by combining market data. Key inputs are as follows.
| Factor | Description |
|---|---|
| Volatility | Current volatility and its ratio to the average |
| Market momentum & volume | Strength of buying pressure and volume |
| Social media sentiment | Mention frequency and positive ratio on Twitter, Reddit, etc. |
| Surveys | Weekly investor sentiment survey |
| Bitcoin dominance | BTC share relative to altcoins |
| Google Trends | Changes in Bitcoin-related search volume |
These six factors are weighted and averaged to produce a 0–100 score. When the index falls to a very low level, it means the market is excessively pessimistic; when it rises to a very high level, it is often interpreted as overheating.
Zone Interpretation and Practical Use
A common zone breakdown is as follows.
- 0–24 Extreme fear: A zone where selling pressure is excessive. More investors consider spot dollar-cost averaging (DCA) buys.
- Fear: A downtrend but the sharp drop has calmed. Watching or small DCA entries appear.
- Greed: Uptrend sentiment begins to spread. Both further upside and short-term correction risk are considered.
- Extreme greed: The market may be overheated. Used as a reference signal to take some profits or reduce exposure.
However, using this index alone to time trades is risky. For example, Bitcoin is currently at $78,855, up 1.6% over 24 hours, but separate signals such as net outflows from ETFs and rising Binance holdings are being spotted at the same time. Even if the Fear & Greed Index points to “fear,” a rebound can be delayed if fund flows are poor. Conversely, even in a “greed” zone, strong momentum can keep the rally going.
Beginners should get into the habit of checking the index alongside RSI, volume, and ETF fund flows. For example, on the Bitcoin live price & AI score page, viewing price and auxiliary indicators together can offset the blind spots of sentiment indicators.
Applying It to the Current Market
Today Bitcoin is approaching a directional decision on the 1-hour and daily charts. With RSI bearish divergence and ETF net outflows being read as short-term correction signals, Binance’s BTC holdings have hit a yearly high, raising caution about potential sell-side supply waiting in the wings. In this environment, the Fear & Greed Index is only an auxiliary compass showing “how scared the market is,” not a buy or sell order by itself.
The Fear & Greed Index is a good starting point for beginners to read market sentiment. However, all investment decisions should be made within your own risk tolerance and after cross-checking multiple indicators. On the Daepak dashboard (/app), you can check the real-time Fear & Greed Index and AI analysis of major coins together.
This information is not investment advice, and the responsibility for investment decisions lies with the investor.