 Daepak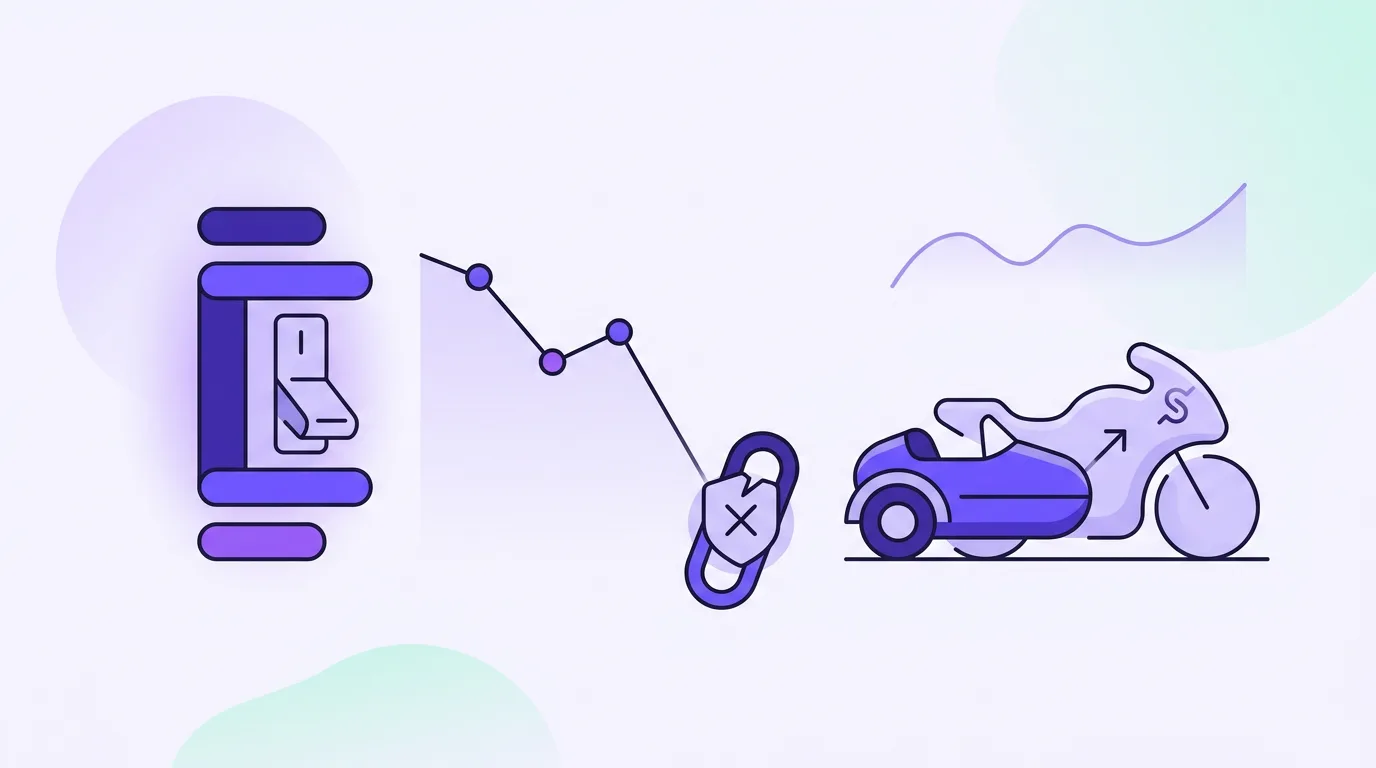
Circuit Breaker vs Sidecar: What's the Difference?
The two mechanisms that often appear in crash news have different roles. Circuit breakers temporarily halt all trading in the cash market, while sidecars stop only program trading quotes for 5 minutes. Usually, a sidecar triggers first, and if the decline deepens, it leads to a circuit breaker.
KOSPI and KOSDAQ Trigger Requirements Compared
Circuit breakers trigger in stages when the KOSPI or KOSDAQ index falls 8% → 15% → 20% or more from the previous close. When triggered, trading is halted for about 20 minutes and then resumes. The higher the stage, the stronger the halt.
Sidecars trigger when futures prices change sharply. For KOSDAQ, if KOSDAQ 150 futures rise or fall 6% or more from the base price and the KOSDAQ 150 index moves 3% or more from the previous trading day's final value for 1 minute, the sidecar takes effect for 5 minutes. KOSPI has a similar structure based on KOSPI 200 futures.
Intraday Checklist for Individual Investors
- First check the 'sidecar triggered' popup and circuit breaker notice on your HTS/MTS (home/mobile trading system) screen.
- Look at KOSPI 200 and KOSDAQ 150 futures prices and index percentage changes together. The flow from a sharp futures move to index following is a clue.
- During a trading halt, new order entry is blocked except for cancellation orders, so check execution prices and order book depth right after resumption.
- Check supply and demand for large caps like Samsung Electronics and SK hynix, and whether foreigners are net buyers. On September 2 intraday, buying in large semiconductor stocks supported the KOSPI downside.
- If virtual assets like Bitcoin are also correcting, it can be seen as a sign of increased stress across risk assets. Check the flow at Bitcoin live price.
What to Remember in a Crash
Circuit breakers and sidecars are mechanisms that halt the market, not signals that change direction. More important than the trigger itself is checking supply and demand and volatility after resumption. In past sharp declines, looking at investor sentiment indicators like how to read the fear and greed index helps distinguish overheating and fear zones.
On the Daepak dashboard (/app), you can check KOSPI and KOSDAQ indices and AI scores for major stocks together. This article is for informational purposes only and cannot be used as a basis for investment decisions.